Using LNT to Track Performance
In the past year, LNT has grown a number of new features that makes performance tracking and understanding the root causes of performance deltas a lot easier. In this post, I’m showing how we’re using these features.
LNT contains 2 big pieces of functionality:
- A server,
a. to which you can submit correctness and performance measurement data, by sending it a json-file in the correct format,
b. that analyzes which performance changes are significant and which ones aren't,
c. that has a webui to show results and analyses in a number of different ways. - A command line tool to run tests and benchmarks, such as LLVM’s test-suite, SPEC2000 and SPEC2006 benchmarks.
The features highlighted focus on tracking the performance of code, not on other aspects LNT can track and analyze.
We have 2 main uses cases in tracking performance:
- Post-commit detection of performance regressions and improvements.
- Pre-commit analysis of the impact of a patch on performance.
Post-commit performance tracking
Step 1. Get an overview of the "Daily Report" page
Assuming your server runs at http://yourlntserver:8000, this page is located at http://yourlntserver:8000/db_default/v4/nts/daily_report
The page gives a summary of the significant changes it found today.
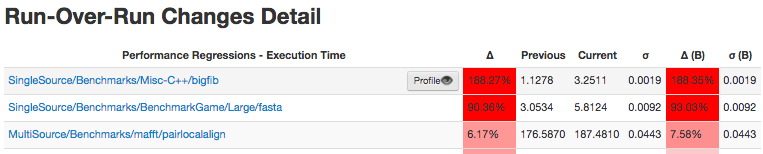
An example of the kind of view you can get on that page is the following

In the above screenshot, you can see that there were performance differences on 3 different programs, bigfib, fasta and ffbench. The improvement on ffbench only shows up on a machine named “machine3”, whereas the performance regression on the other 2 programs shows up on multiple machines.
The table shows how performance evolved over the past 7 days, one column for each day. The sparkline on the right shows graphically how performance has evolved over those days. When the program was run multiple times to get multiple sample points, these show as separate dots that are vertically aligned (because they happened on the same date). The background color in the sparkline represents a hash of the program binary. If the color is the same on multiple days, the binaries were identical on those days.
Let’s look first at the ffbench program. The background color in the sparkline is the same for the last 2 days, so the binary for this program didn’t change in those 2 days. Conclusion: the reported performance variation of -8.23% is caused by noise on the machine, not due to a change in code. The vertically spread out dots also indicate that this program has been noisy consistently over the past 7 days.
Let’s now look at the bigfib. The background color in the sparkline has changed since its previous run, so let’s investigate further. By clicking on one of the machine names in the table, we go to a chart showing the long-term evolution of the performance of this program on that machine.
Step 2. The long-term performance evolution chart

This view shows how performance has evolved for this program since we started measuring it. When you click on one of the dots, which each represent a single execution of the program, you get a pop-up with information such as revision, date at which this was run etc.
When you click on the number after “Run:” in that pop-up, it’ll bring you to the run page.
Step 3. The Run page
The run page gives an overview of a full “Run” on a given machine. Exactly what a Run contains depends a bit on how you organize the data, but typically it consists of many programs being run a few times on 1 machine, representing the quality of the code generated by a specific revision of the compiler on one machine, for one optimization level.
This run page shows a lot of information, including performance changes seen since the previous run:
When hovering with the mouse over entries, a “Profile” button will show, that when clicked, shows profiles of both the previous run and the current run.
Step 4. The Profile page
At the top, the page gives you an overview of differences of recorded performance events between the current and previous run.

After selecting which function you want to compare, this page shows you the annotated assembly:
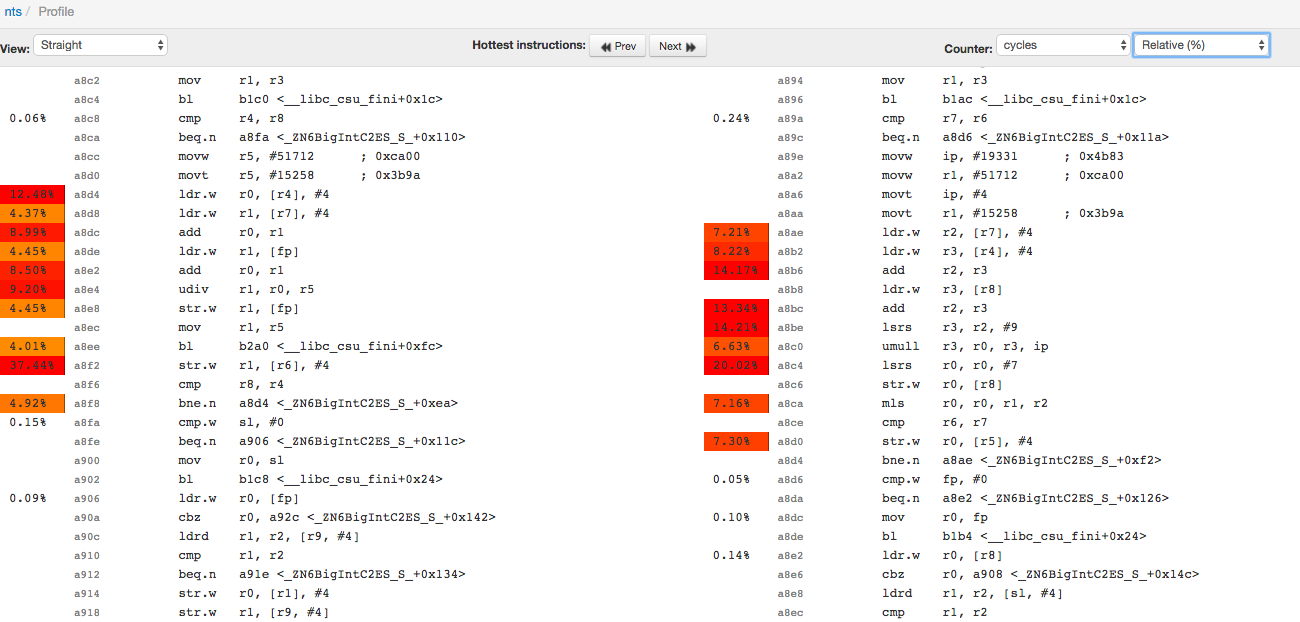
While it’s clear that there are differences between the disassembly, it’s often much easier to understand the differences by reconstructing the control flow graph to get a per-basic-block view of differences. By clicking on the “View:” drop-down box and selecting the assembly language you see, you can get a CFG view. I find showing absolute values rather than relative values helps to understand performance differences better, so I also chose “Absolute numbers” in the drop down box on the far right:

There is obviously a single hot basic block, and there are differences in instructions in the 2 versions. The number in the red side-bar shows that the number of cycles spent in this basic block has increased from 431M to 716M. In just a few clicks, I managed to drill down to the key codegen change that caused the performance difference!
We combine the above workflow with the llvmbisect tool available at http://llvm.org/viewvc/llvm-project/zorg/trunk/llvmbisect/ to also quickly find the commit introducing the performance difference. We find that using both the above LNT workflow and the llvmbisect tool are vital to be able to act quickly on performance deltas.
Pointers on setting up your own LNT server for tracking performance
Setting up an LNT server is as simple as running the half a dozen commands documented at http://lnt.llvm.org/quickstart.html under "Installation" and "Viewing Results". The "Running tests" section is specific to LLVM tests, the rest is generic to performance tracking of general software.
The documentation for the json file format to submit results to the LNT server is here: http://lnt.llvm.org/importing_data.html.
The documentation for how to also add profile information, is at http://lnt.llvm.org/profiles.html.