GSoC 2024: Statistical Analysis of LLVM-IR Compilation
Welcome! My name is Andrew and I contributed to LLVM through the 2024 Google Summer of Code Program. My project is called Statistical Analysis of LLVM-IR Compilation. The objective of this project is to provide an analysis of how time is spent in the optimization pipeline. Generally, drastic differences in the percentage of time spent by a pass in the pipeline is considered abnormal.
Background
In principle, an LLVM IR bitcode file, or module, contains IR features that determine the behavior of the compiler optimization pipeline. By varying these features, the optimization pipeline, opt, can add significantly to the compilation time or marginally. More specifically, optimizations succeed in less or more time; the user can wait for a microsecond or a few minutes. LLVM compiler developers constantly edit the pipeline, so the performance of these optimizations can vary by compiler version (sometimes significantly).
Having a large IR dataset such as ComPile allows for testing the LLVM compilation pipeline on a varied sample of IR. The size of this sample is sufficient to determine outlying IR modules. By identifying and examining such files using utilities which are being added to the LLVM IR Dataset Utils Repo, the causes of unexpected compilation times can be determined. Developers can then modify and improve the compilation pipeline accordingly.
Summary of Work
The utilities added in PR37 are intended to write each IR module to a tar file corresponding to a programming language. Each file written to the tar files is indexed by its location in the HF dataset. This allows easy identification of files for tools which can be used for data extraction and analysis in the shell, notably clang. Tar file creation allows for potentially using less storage space then downloading the HF dataset to disk, and it allows code to be written which does not depend on the Python interpreter to load the dataset for access.
The Makefile from PR36 is responsible for carrying out the data collection. This data includes text segment size, user CPU instruction counts during compile time (analogous to time), IR feature counts sourced from the LLVM pass print<func-properties>, and maximum relative time pass names and percentage counts. The data can be extracted in parallel or serially and is stored in a CSV file.
An important data collection command in the Makefile is clang -w -c -ftime-report $(lang)/bc_files/file$@.bc -o /dev/null. The output from the command is large, but the part of interest is the first Pass execution timing report:
===-------------------------------------------------------------------------===
                          Pass execution timing report
===-------------------------------------------------------------------------===
  Total Execution Time: 2.2547 seconds (2.2552 wall clock)

   ---User Time---   --System Time--   --User+System--   ---Wall Time---  --- Name ---
   2.1722 ( 96.5%)   0.0019 ( 47.5%)   2.1741 ( 96.4%)   2.1745 ( 96.4%)  VerifierPass
   0.0726 (  3.2%)   0.0000 (  0.0%)   0.0726 (  3.2%)   0.0726 (  3.2%)  AlwaysInlinerPass
   0.0042 (  0.2%)   0.0015 ( 39.2%)   0.0058 (  0.3%)   0.0058 (  0.3%)  AnnotationRemarksPass
   0.0014 (  0.1%)   0.0005 ( 13.3%)   0.0019 (  0.1%)   0.0020 (  0.1%)  EntryExitInstrumenterPass
   0.0003 (  0.0%)   0.0000 (  0.0%)   0.0003 (  0.0%)   0.0003 (  0.0%)  CoroConditionalWrapper
   2.2507 (100.0%)   0.0039 (100.0%)   2.2547 (100.0%)   2.2552 (100.0%)  Total
A user can visually see the distribution of these passes by using a profiling tool for .json files. The .json file for a given bitcode file is obtained by clang -c -ftime-trace <file>.
The visualization of this output can be filtered to the passes of interest as in the following image:
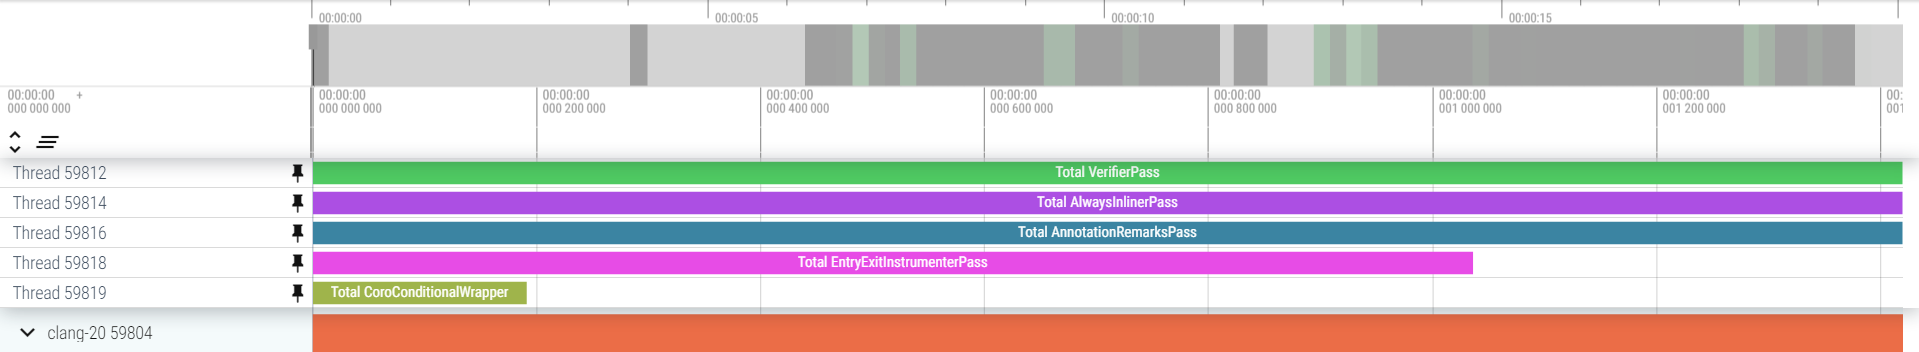
The CoroConditionalWrapper pass is accounted by the “Total CoroConditionalWrapper” block. Clearly, that pass takes a far smaller amount of time than the others, as accounted for by the pass execution timing report. However, instead of seeing the pass as an insignificant percentage of time, the visualization allows for additional comparisons of the relative timings of each pass. The example image has the optimization passes of interest selected, but the .json file provides information on the entire compilation pipeline as well. Thus, the entire pipeline execution flow can be visualized.
Current Status
Currently, there are three PRs that require approval to be merged. There has been ongoing discussion on their contents, so few steps should be left to merge them. In the current state, users of the utilities in PR38 should be able to readily reproduce the quantitative results I had obtained for my GSoC midterm presentation graphs. Users can easily perform outlier analysis as well on the IR files (excluding Julia IR). Some of the results include the following:
Scatter Plot of C IR Files:
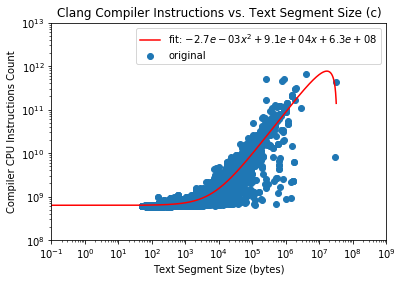
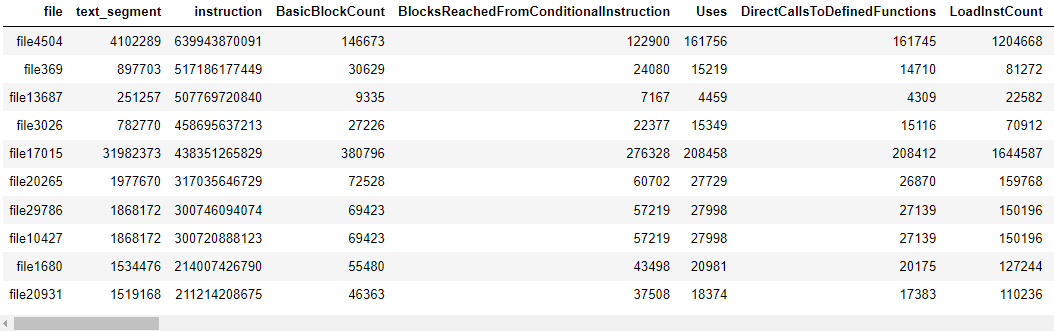
Table of outliers for C IR files:
Future Work
It was discussed in PR 37 to consolidate the tar file creation into the dataset file writer Python script. This is a feature I wish to implement in order to speed up the tar file creation process by having the bitcode files written from memory to the tar instead of from memory, to disk, to tar.
As mentioned, Julia IR was not analyzed. Modifying the scripts to include Julia IR results is desirable to make complete use of the dataset. Adding additional documentation for demonstration-of-use purposes could help clarify ways to use the tools.
Additionally, outlier analysis can be expanded upon by using more advanced outlier detection methods. Not all the data collected in the CSV files was used, so using those extra features–in particular the print<func-properties> pass–can allow for improved accuracy in outlier detection.
Acknowledgements
I would like to thank my mentors Johannes Doerfert and Aiden Grossman for their constant support during and prior to the GSoC program. Additionally, I would like to acknowledge the work of the LLVM Foundation admins and the GSoC admins.